


Some Projects
A glimpse into my recent geospatial work.

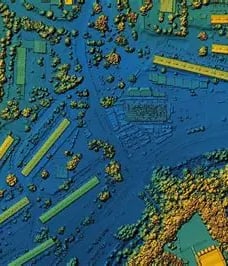
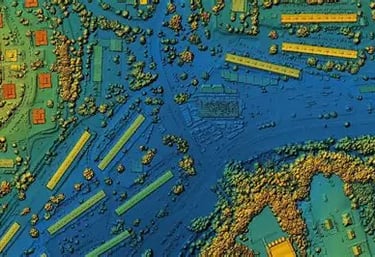
Hydrology Study
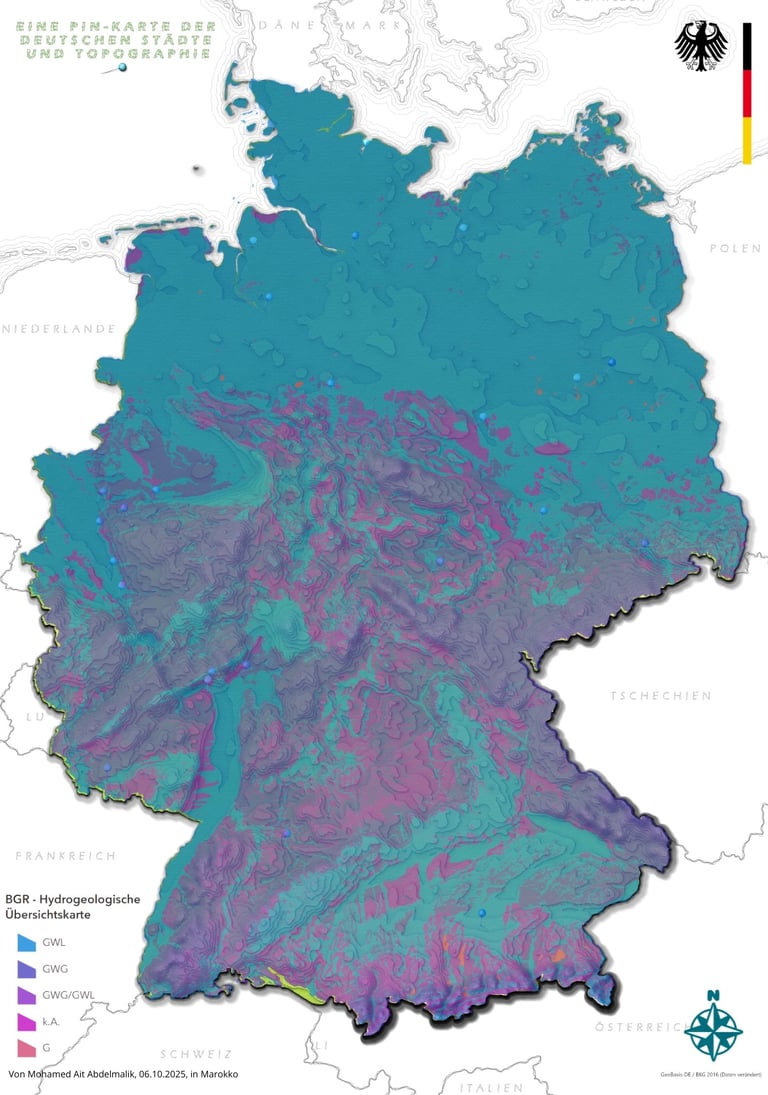
The Hydrogeological Overview Map of #Germany (HÜK250) — a detailed hydrogeological interpretation of the country’s main groundwater systems, based on data from the Bundesanstalt für Geowissenschaften und Rohstoffe (BGR) and the State Geological Surveys (SGD).
About the dataset:
The HÜK250 (Hydrogeologische Übersichtskarte 1:250,000) describes the hydrogeological characteristics of Germany’s upper, regionally continuous, and economically significant aquifers. It includes seven key attributes:
Permeability (Durchlässigkeit)
Geochemical rock type
Rock type / lithology
Porosity type (Hohlraumart)
Consolidation / degree of compaction (Verfestigung)
Stratigraphy
Applied Python and IBM data analyst skills to clean and interpret geospatial datasets, enhancing insights for environmental projects.
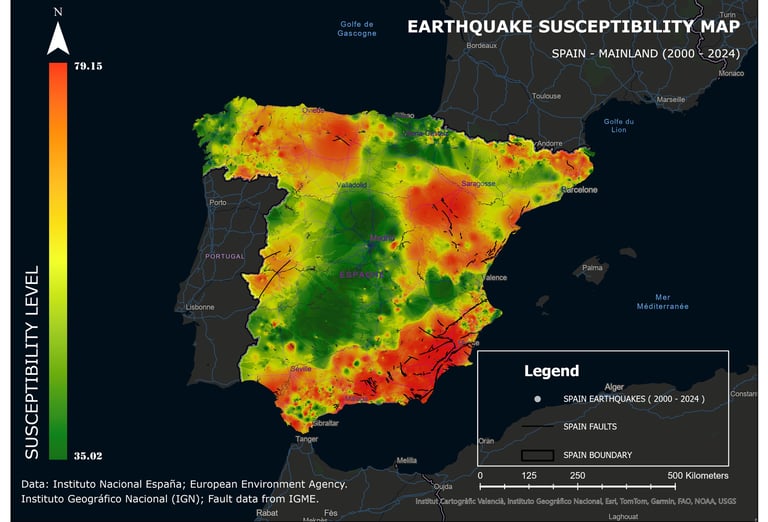
Earthquake Susceptibility Map Of SAPIN
This map analyzes earthquake risk levels in Spain for the period from 2000 to 2024.
The highest risk zones are concentrated in southern and southeastern Spain, especially in the provinces of Granada, Almería, and the city of Murcia. The main reason for the elevated risk in these areas is the presence of active tectonic faults, where the African and Eurasian plates meet, leading to frequent and sometimes strong earthquakes.
Some regions in the northeast (near Catalonia) also show a moderate risk level due to certain secondary faults. In contrast, the central and northwestern regions of Spain exhibit relatively low exposure to earthquake risk, as these areas are farther from active plate boundaries.
The significance of this map lies in its role in helping authorities and residents with urban planning and safety measures, taking into account the population distribution and infrastructure in high-risk areas to mitigate the effects of future earthquakes and to improve emergency response.
Project Overview:
🗂️Data Sources:
Earthquake records (2000–2024)
Geological fault lines
Lithology layer of the Iberian Peninsula
🛠️ Tools and Techniques Used in ArcGIS Pro:
Kernel Density Estimation (KDE) for seismic and fault intensity
IDW (Inverse Distance Weighting) for interpolating earthquake magnitude and depth
Euclidean Distance for proximity to faults
Raster Calculator for normalization and multi-criteria weighted overlay
📐Raster Normalization Equations:
Positive Influence (e.g., magnitude, density):
("raster" - "raster".minimum) / ("raster".maximum - "raster".minimum) 100
Negative Influence (e.g., depth):
("raster" - "raster".maximum) / ("raster".minimum - "raster".maximum) 100
🧮Final Weighted Overlay Equation:
(rc-ed-faults 0.05) + (rc-idw-depth 0.23) + (rc-speed 0.03) + (rc-kd-faults 0.15) + (rc-idw-mag 0.46) +(rc-kd-quakes 0.09)
All layers were reclassified into 5 classes (quantiles), from Very Low to Very High susceptibility.
🎯Project Goal:
To combine geological and seismic data using spatial analysis to model earthquake-prone zones. This approach supports risk mitigation, civil protection planning, and scientific visualization.
Data Sources:
Instituto Geográfico Nacional (IGN) for earthquake data
IGME (Instituto Geológico y Minero de España) for fault datasets
Instituto Geográfico Nacional (IGN), España; European Environment Agency (EEA)
Analyzed watershed patterns using ArcGIS Pro to support sustainable water management, integrating DEM data for accurate terrain modeling.
Experience
Currently I’ve started my Master of Technology - MScTech in Geoinformatics Applied to Geosciences and the Environment at Université Hassan II Casablanca.
Skills
GIS & Coding
Proficient in ArcGIS Pro QGIS, Python,


Certifications
Academic Degree
Bachelor’s Degree in Geology – from Faculté des Sciences Semlalia, Université Cadi Ayyad (Marrakech, Morocco)
Professional Certificates
IBM Data Analyst Certificate – covering data analysis, Excel, Python, SQL, and data visualization.
Geospatial Data Analytics Essential Training Certificate (completed February 4, 2025) – covering GIS, geospatial data, and Python.
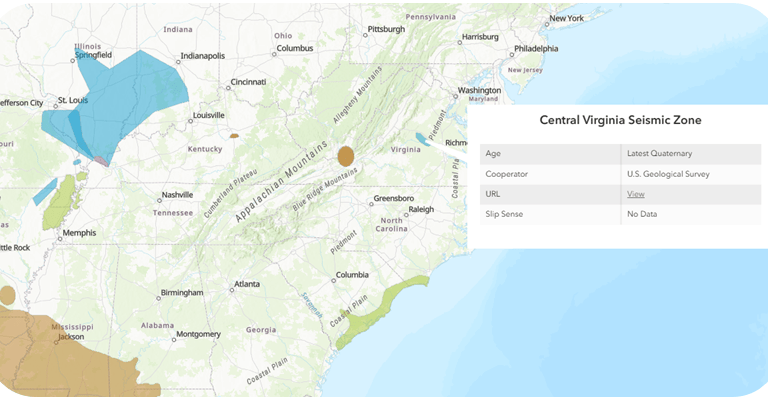
Earthquake Faults and Folds in the USA
Earthquake Faults and Folds in the USA
This feature layer, utilizing data from the U.S. Geological Survey"s (USGS) Earthquake Hazards Program (EHP), displays known faults and folds in the U.S. This layer, per USGS, "contains information on faults and associated folds in the United States that demonstrate geological evidence of coseismic surface deformation in large earthquakes during the past 1.6 million years (Myr)."
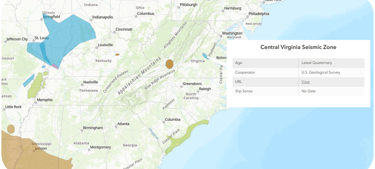
Data downloaded: April 2025
Data source: Faults
Data modification: non
For more information: Earthquake Hazards
For feedback please contact: ArcGIScomNationalMaps@esri.com
Note: the map is designed to be displayed at a "States scale", in order to showcase the contents more efficiently.
Iceland Tectonic Geology _ Map View
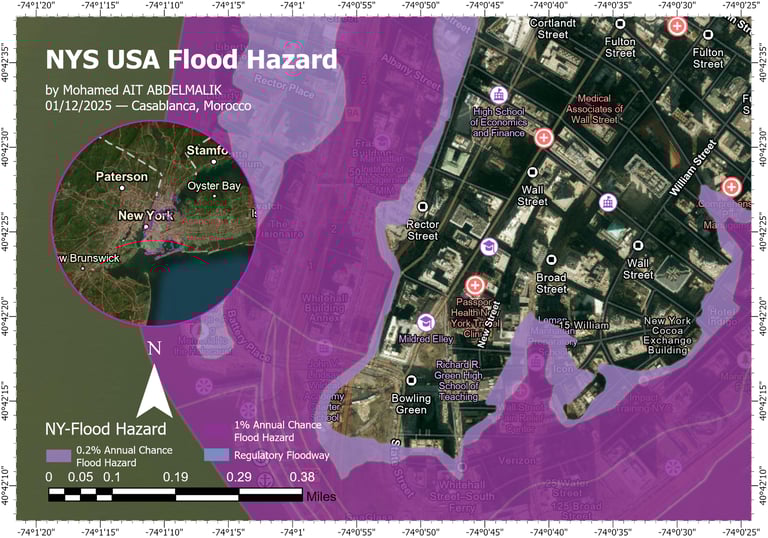
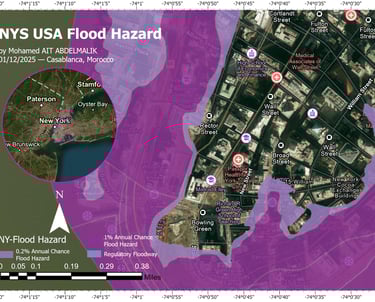
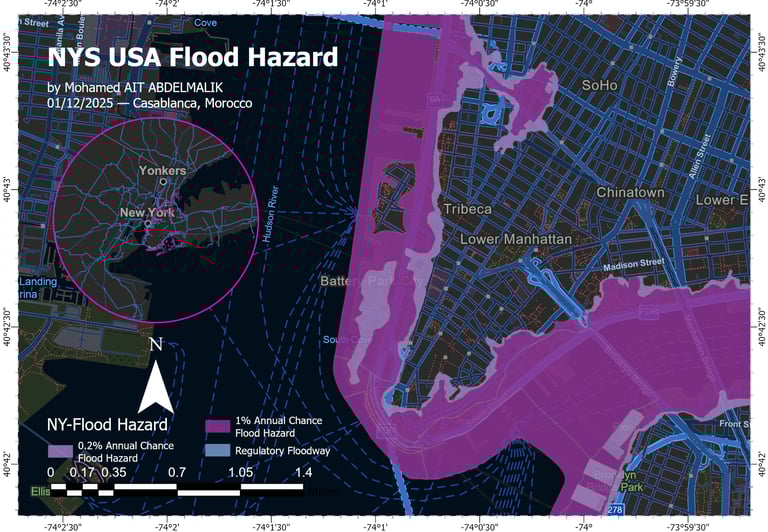
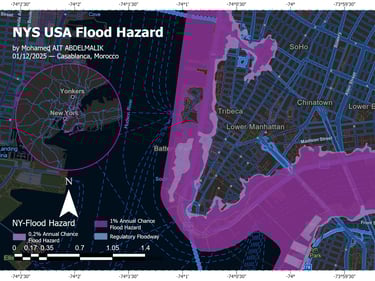
NY Flood Hazard Areas — Map Layouts & Online Web Map Published.
The NY Flood Hazard Areas project is now fully prepared with professional map layouts and published as an interactive web map on ArcGIS Online.
This work uses FEMA’s latest (May 7, 2025) National Flood Hazard Layer (NFHL), following the official symbology and optimized for high-quality visualization and analysis.
📌 What’s included:
Clean, high-resolution map layouts (PDF/print-ready)
Interactive ArcGIS Online web map
FEMA Special Flood Hazard Areas (SFHA)
1% annual-chance flood zones & coastal flood zones
Geometry repaired + performance-optimized dataset
Web Mercator projection for full online compatibility
🌐 Explore the NY-USA-wide flood hazard map : https://lnkd.in/edZKibmg
🛠️ Use cases:
Flood risk assessment
Emergency planning
Urban & environmental planning
Spatial analysis and hazard communication
About Me
Currently I’ve started my Master of Technology - MScTech in Geoinformatics Applied to Geosciences and the Environment at Université Hassan II Casablanca. passionate about geospatial data and hydrology.


Get in Touch
Feel free to reach out for collaborations or questions about my geospatial projects.
Phone
+2126 51853618
mohamed.aitabdelmalik@gmail.com